 eAtlas Data Catalogue
ocean acidification
Type of resources
Topics
Keywords
Contact for the resource
Provided by
Representation types
status
-
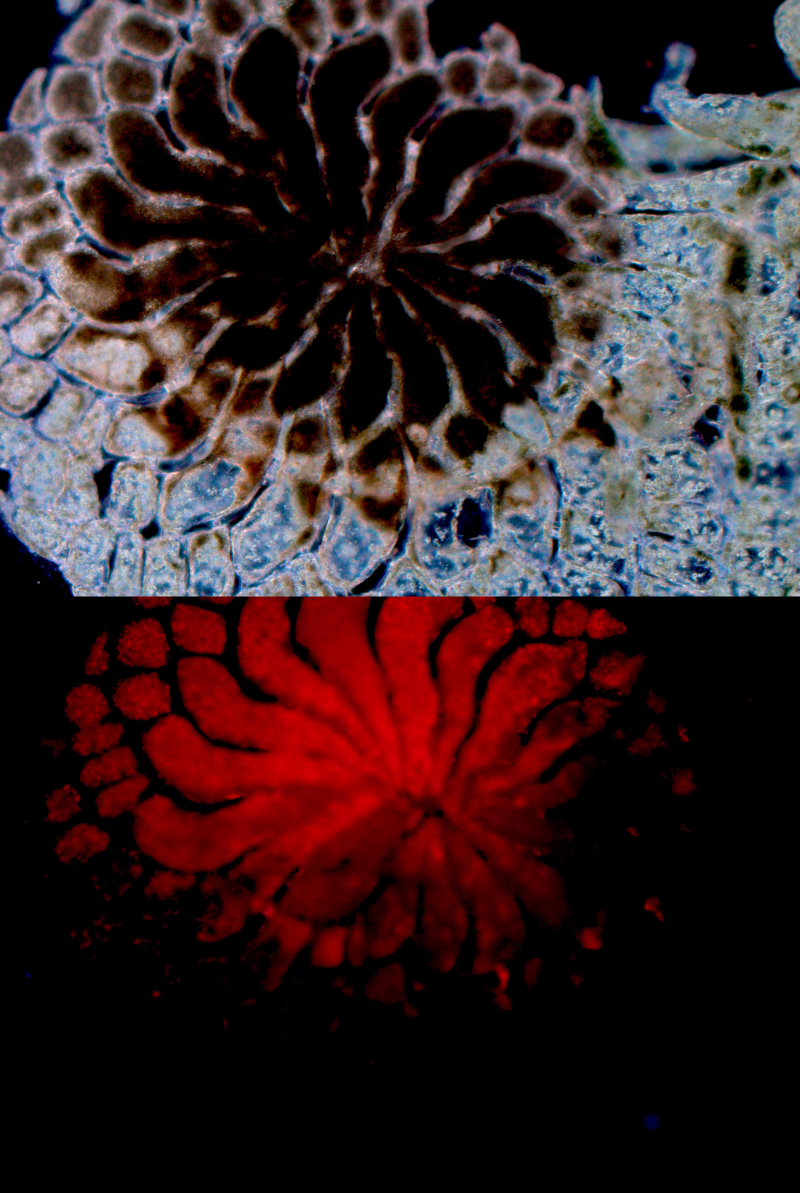
This dataset measures 5 effects of temperature and pH stressors (individual and combined) on tropical Foraminifera. The effects measured are: respiration, survivorship, growth, chl-a content and photochemistry. The study was conducted in 2011 and the data is provided as 5 single sheet spreadsheets. Warming and changes in ocean carbonate chemistry alter marine coastal ecosystems at an accelerating pace. Here we investigate the individual effects as well as the interaction of two stressors, temperature and pH on two species of benthic coral reef Foraminifera. This study consisted of a 7 week aquarium experiment manipulating temperature and pH changes and measuring survivorship, growth, photosynthesis, respiration and chl-a content in these benthic coral reef Foraminifera. Method: Specimens were collected from Orpheus Island in the central Great Barrier Reef in September 2011. H. depressa was collected at a depth of 8–12 m from coral rubble at Cattle Bay (18°34’08’’ S 146°28’55’’ E) and M. vertebralis at a depth of 0–1 m (below Lowest Astronomical Tide) from turf algae-covered rocks at Hazard Bay (18°38’58’’ S 146°29’11’’ E). Both species were acclimated to laboratory conditions in tanks with moderate flow-through conditions (same as used in experimental setup) under low-light conditions (10 µmol photons m-2 s-1) for a period of 3 weeks. 12 flow-through aquaria (working volume 17.5 L) were installed in a constant temperature room, and the experiment was carried out over a period of 53 d. Specimens were kept inside custom made flow-through housings in each aquarium to achieve higher flow conditions more closely mimicking their habitat than in previous experiments. Flow-through housings contained two levels made from two standard 6-well cell culturing plates with flow-through lids. Twenty-four specimens (four specimens per well) of H. depressa were put in the lower level and the same number of M. vertebralis in the top level. For each temperature (28 and 31 ºC) and pCO2 level (~790 µatm, pHNIST 7.9 and ~490 µatm, pHNIST 8.1), three replicate tanks were used; replicate tanks were randomly allocated to treatments. Seawater was pumped from the ocean into the laboratory, filtered to 5 µm, and stored in four header tanks where it was modified to the desired experimental conditions. Manual temperature and pH measurements were performed once to twice per day. Water samples for total alkalinity (AT) and dissolved inorganic carbon (DIC) determinations were taken weekly and analysed by AIMS Laboratory Services. Flow rates into the individual wells were recorded before and after the experiment, ranging between 180 and 220 mL min-1. Velocity of the water flow varied from 4.2–5.2 9 10-1 m s-1 at the inlet (Ø 0.3 cm) to 3.1–3.8 9 10-3 m s-1 at the outlet (Ø 3.5 cm). The flow rates between inlet and outlet are in the same range as those measured in situ over dead coral rubble and sea grass. Flow-through housings were made containing two levels so that one species could be kept in the top level exposed to higher light levels than the species in the lower level. Light levels were chosen for each species separately because of their known distributions and different light saturation points determined by pulse amplitude modulation (PAM) fluorometry. PAM fluorometry results for M. vertebralis indicated a maximum saturating irradiance (Ek) between 100 and 140 µmol photons m-2 s-1 and for H. depressa between 40 and 60 µmol photons m-2 s-1 (Ziegler and Uthicke 2011). The light levels used in the experiment were chosen to fall below the Ek values by Ziegler and Uthicke (2011) and P–I curve Pmax values determined by Vogel and Uthicke (2012) and were selected to correspond to levels which have shown no changes in mortality rates or chlorophyll a concentrations in previous experimental manipulations of the studied species. Further detail can be found in this publication: Schmidt, C., Kucera, M., & Uthicke, S. (2014). Combined effects of warming and ocean acidification on coral reef Foraminifera Marginopora vertebralis and Heterostegina depressa. Coral Reefs, 33(3), 805-818. DOI 10.1007/s00338-014-1151-4 Format: 5 text (csv) files are given, one for each measurement. The 5 tables are listed below where: Species: H=Heterostegina, M=Marginopora Temperature: °C Treatment: abbr. of Temp°C, and pH 1.) Foraminifera_survivorship.csv Tank, Species, Real Temp (°C), Real pH, Treatment 2.) Foraminifera_PAM_data.csv Tank, Well, MQY (Maximum Quantum Yield, Fv:Fm), EQY (Effective Quantum Yield), Ps (Apparent Photosynthetic Rate), Treatment, Species 3.) Foraminfera_Respiration_data.csv Respiration [µg O2 h-1 mg-1], Production [µg O2 h-1 mg-1], Net production, Tank, Species, Absolute Respiration (Respiration given as positive), Treatment 4.) Foraminifera_growth.csv Aquaria Number, Well, Area Inital (mm2), Area Final (mm2), Growth (%/day), Treatment, Real Temp, Real pH, Species (Averages given per Well in Marginopora, individual sizes per well in Heterostegina) 5.) Foraminifera_chla content-csv Treatment, Chl a (µg pigment/ mg wet weight of the Foraminifera), Tank, Species
-
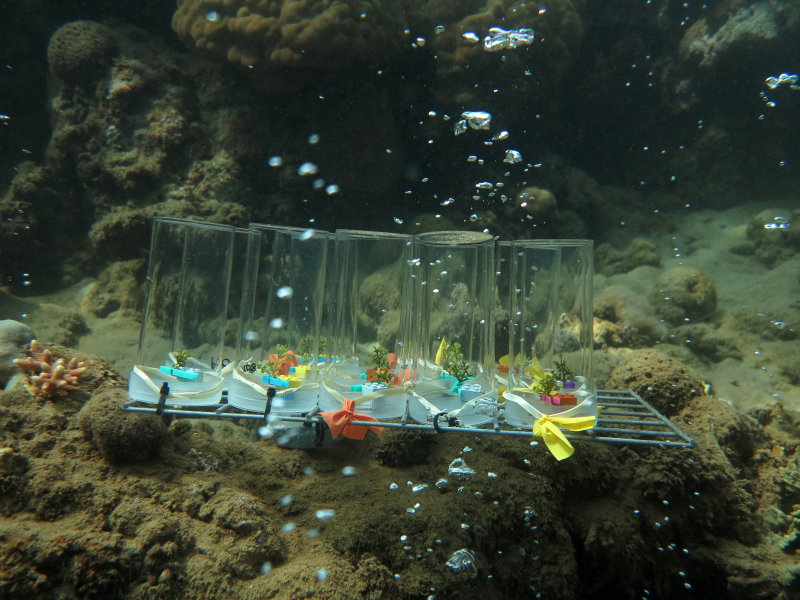
This dataset consists of one csv data file from field derived experiments at tropical carbon dioxide seeps in Papua New Guinea, measuring the response parameters: calcification, photosynthesis, carbon and nitrogen contents and carbon isotopic signatures on Halimeda opuntia grown under ocean acidification conditions. The aim of this study was to investigate the effects of ocean acidification on Halimeda opuntia grown under ocean acidification conditions at tropical carbon dioxide seeps. Therefore we tested several response parameters to try to understand how the calcareous alga is capable of growing under ocean acidification conditions. Method: At several locations in Milne Bay Province, Papua New Guinea, volcanic CO2 is seeping out of the seafloor (Fabricius et al. 2011). The seep sites are located at Dobu Island and Upa-Upasina (Normanby Island) close to the shore in shallow water of ~1–15 m depth and extend over an area of ~20 by 100 m with different intensities of bubble activity within this area. Control reefs were allocated several hundred meters away from the seep sites with no impact of the seep activity on their seawater carbonate system. The bubbles, which consist of pure CO2, ascend to the surface and mix with the ambient seawater, changing the carbonate chemistry. This study was confined to areas where seawater chemistry was altered to levels projected for a vast part of the globe for the end of this century (‘representative concentration pathway’ RCP6.0 to RCP8.5 scenarios) (Moss et al. 2010). Calcification rates in the light and dark, as well as net photosynthesis and respiration rates, were measured in-situ at control (pHtotal = 8.17) and seep sites (pHtotal = 7.77). Branches 5 – 8 cm in height and with ~20 phylloids of H. opuntia were collected and retained at the site of collection until incubations commenced. Light incubations were conducted in-situ at 5 m water depth at midday. Specimens were placed into 0.5 L clear Perspex chambers, simultaneously at control and seep sites, by two separate SCUBA diving teams. After ~3 h incubation under ambient light, incubation chambers were retrieved and a water subsample was directly analyzed for total alklinity. Oxygen concentration was determined in each incubation chamber including two blank incubations per treatment (to correct for seawater production/ respiration) with a hand-held dissolved oxygen meter (HQ30d, Hach, USA). Light intensities of incubation conditions were recorded by two light loggers (Odyssey, New Zealand) each at control and seep site. Photosynthetically available radiations (PAR) was dependent on weather conditions and averaged 259 and 281 µmol photons m-2 s-1 for H. opuntia incubations. Dark incubations were conducted on board the research vessel for ~3 h in the evening. The incubation chambers were filled with water from the site of origin of the plants (control vs. seep site). Chambers were placed in black plastic bins (45 L) with lids for darkening and flow-through seawater for temperature control. Rates of calcification were determined with the alkalinity anomaly technique (Chisholm and Gattuso 1991). Calcification rates (in µmol L-1 C h-1 gFW-1) and oxygen fluxes (in µg O2 h-1 gFW-1) were calculated in relation to blank incubations and standardized to the fresh weight (FW) of the plants. Daily net calcification rates were calculated by 12h of daylight and 12h of darkness. Apical phylloids of dried Halimeda spp. were crushed with mortar and pestle and the homogenate was analyzed for total carbon (Ctot) and total nitrogen (N) on a Flash EA 1112 elemental analyzer (Thermo Fisher Scientific, USA). In addition, organic carbon (Corg) contents were measured after acidifying the sample with 150µL concentrated HCl to drive out Cinorg. Inorganic carbon content was calculated by subtracting Corg from Ctot. Stable isotope signatures were measured in a subset of these samples using a Delta S mass spectrometer (Thermo Fisher Scientific, USA) coupled with the elemental analyzer. Further details can be found in the publication: Vogel, N., Fabricius, K. E., Strahl, J., Noonan, S. H. C., Wild, C. and Uthicke, S. (2015), Calcareous green alga Halimeda tolerates ocean acidification conditions at tropical carbon dioxide seeps. Limnology and Oceanography, 60: 263–275. doi: 10.1002/lno.10021 Format: This dataset comprises a single csv file, Vogel_acid_opuntia.csv. Data Dictionary: The columns of the Vogel_acid_opuntia.csv are described below: - Species: Halimeda opuntia - Treatment: Site of collection/ measurement, seep site or control reef - Light calcification: calcification in light, given in µmol L-1 C h-1 gFW-1 - Dark calcification: calcification in darkness, given in µmol L-1 C h-1 gFW-1 - Net calcification: 12xlight+12xdark calcification, given in µmol L-1 C d-1 gFW-1 - Net photosynthesis: oxygen production in light, given in µmol L-1 O2 h-1 gFW-1 - Dark respiration: oxygen respiration in darkness, given in µmol L-1 O2 h-1 gFW-1 - Gross photosynthesis: oxygen production – dark respiration, given in µmol L-1 O2 h-1 gFW-1 - Ctot: total carbon content, given in molar % - Corg: organic carbon content, given in molar % - Cinorg: inorganic carbon content (Ctot-Corg), given in molar % - N: total nitrogen content, given in molar % References: Chisholm JRM, Gattuso JP (1991) Validation of the alkalinity anomaly technique for investigating calcification and photosynthesis in coral-reef communities. Limnol Oceanogr 36:1232-1239 Fabricius KE, Langdon C, Uthicke S, Humphrey C, Noonan S, De'ath G, Okazaki R, Muehllehner N, Glas MS, Lough JM (2011) Losers and winners in coral reefs acclimatized to elevated carbon dioxide concentrations. Nature Climate Change 1:165 - 169 Moss RH, Edmonds JA, Hibbard KA, Manning MR, Rose SK, van Vuuren DP, Carter TR, Emori S, Kainuma M, Kram T (2010) The next generation of scenarios for climate change research and assessment. Nature 463:747-756
-
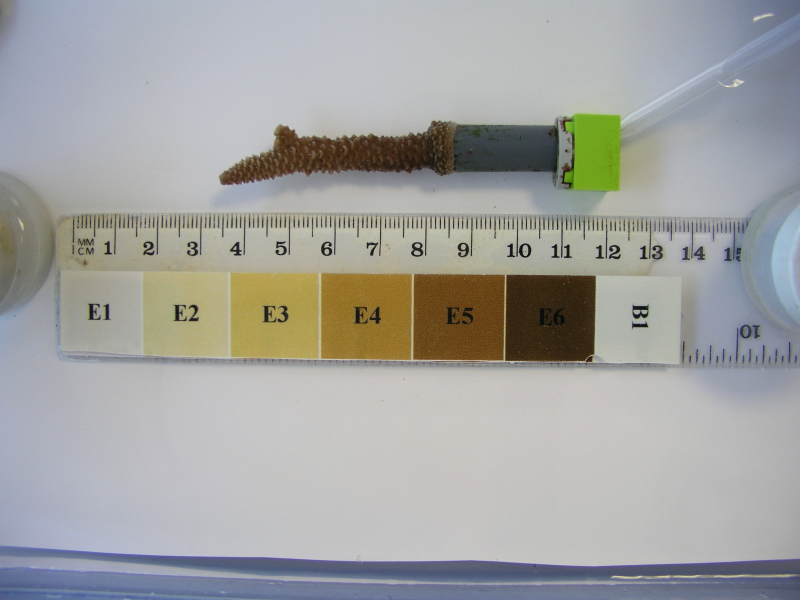
This dataset consists of one data file from a 16 day aquarium experiment manipulating pH and light level and measuring growth, photosynthesis, calcification and pigment content of Acropora millepora. The aim of this study was to test the hypothesis that a combined effect of decreased pH and decreased light on physiological responses of the coral is larger than that of each stressor individually. Method: Colonies of the coral Acropora millepora were collected from an inshore fringing reef next to Pelorus Island (central section of the Great Barrier Reef (GBR); 18° 33.001’ S, 146° 29.304’ E) between 2 and 4 m below lowest astronomical tide (LAT). After colonies were fragmented, individual coral nubbins were glued onto stubs and kept at the Australian Institute of Marine Science (AIMS, Townsville) in flow-through (recirculating flow ~1200 l h-1) aquaria facilities under plasma light (150 µmol photons m-2 s-1) for >3 mo. Nubbins were transferred into experimental tanks 2 weeks prior to the start of experiment to acclimate to experimental control conditions. Light levels chosen as the control and low light conditions were well within average ranges found between 3 and 6 m below LAT at midshelf and inshore reefs on the GBR, respectively. The manipulative aquaria experiment was carried out in flow-through conditions over a period of 16 days between July and August 2012 at AIMS. After two weeks acclimation, four nubbins of A. millepora were allocated to each of the twelve experimental aquaria. Four treatments with three replicate tanks (working volume 17.5 L) were placed in alternating order. Treatments consisted of combinations of ambient pCO2 (427 µatm), high pCO2 (1073 µatm), low light (35 µmol photons m-2 s-1) and control light (150 µmol photons m-2 s-1). Light intensities were chosen from average PAR readings from an inshore and mid-shelf reef at ~ 5 m below LAT, present during the summer months. Water flow was provided with fresh filtered (0.5 µm) seawater at 25 °C, with a salinity of 34.5, at a flow-rate of 150 mL min-1. Irradiance was delivered by white light LED (6000 K, Aqua Illumination), covering the full color spectrum. Light levels were set to 12 h/ 12 h light-dark cycle. Additional aquaria pumps (AquarWorld, Australia, 250 L h-1) were fitted into each tank to assure water movement. Target pH levels were achieved by an automatic CO2 injection system (Aqua Medic, Germany) controlled by potentiometric pH sensors. Growth of organisms was determined by the buoyant weight technique. Individual specimens were single-weighted (accuracy: 0.1 mg, Mettler Toledo, USA) in a custom build buoyant weight set-up with water jacket and seawater of constant temperature (25 °C) and salinity (34.5 ppt) at the start and at the end of the experiment. Growth of organisms was expressed as daily percentage of change. After 16 days in experimental conditions, two individuals of each replicate tank were incubated for 1 h in the light and thereafter 1 h in the dark to determine calcification and photosynthesis. Light intensity and seawater pH of incubations corresponded to treatment condition of each organism. One experimental run consisted of 12 parallel incubations in 200 mL incubation chambers, including two blanks per treatment. To assure constant water temperature during incubation, chambers were placed into a flow-through water bath at 25 °C. Additionally, magnetic stirrer bars ensured water movement within the incubation chambers. Calcification rates in light and dark were determined by the alkalinity anomaly technique (Chisholm & Gattuso 1991). A subsample of 50 mL was pipetted from the incubation seawater and directly titrated for total alkalinity (AT) on a Metrohm 855. A change in one mole of AT corresponds to a change of half a mole of calcium carbonate (Gao and Zheng 2010). Thus, calcification can be expressed by determining the change of carbon in calcium carbonate. Calcium carbonate precipitation or dissolution in µM C h-1 was calculated following Gao and Zheng (2010) and standardized to organisms’ surface area. Net photosynthesis in the light or dark respiration were monitored consecutively during the incubations by three Firesting 4-channel oxygen meters (Pyroscience, Germany), which were connected to each chamber with fibre optic cables. Gross photosynthesis, net photosynthesis and respiration rates were expressed as µM O2 h-1 and standardized to organism surface area. Chlorophyll a content of coral A. millepora was determined after coral tissue was stripped from the skeleton with an air gun utilizing fresh, ultra-filtered (0.2 µm) seawater. Zooxanthellae were isolated from the host tissue and re-suspended in 2 mL of ethanol (EtOH 95%), heat shocked and extracted for 24h in the cold. Absorbencies were read on 750 and 664 nm and Chl a content was calculated standardized to nubbin surface area. References: Gao K, Zheng Y (2010) Combined effects of ocean acidification and solar UV radiation on photosynthesis, growth, pigmentation and calcification of the coralline alga Corallina sessilis (Rhodophyta). Global Change Biol 16:2388-2398 Chisholm JRM, Gattuso JP (1991) Validation of the alkalinity anomaly technique for investigating calcification and photosynthesis in coral-reef communities. Limnol Oceanogr 36:1232-1239 Format: A single csv text file, Acid_Light_Millepora_Growth.csv Data Dictionary: - Tank: running number of tanks in experiment - pH: single factor pH - Light: single factor light - Treatment: combined factor of pH and light - Growth: increase in buoyant weight of coral after 16 days of experimental treatment given in % change d-1 - Light calcification: calcification in light, given in µM C h-1 cm-2 - Dark calcification: calcification in darkness, given in µM C h-1 cm-2 - Net calcification: light calcification + dark calcification - Net photosynthesis: oxygen production during light, given in µM O2 h-1 cm-2 - Respiration: oxygen consumption during darkness, given in µM O2 h-1 cm-2 - Gross photosynthesis: net photosynthesis – respiration - Chlorophyll: Chlorophyll a content after 16 days in experimental conditions, given in µg cm-2
-
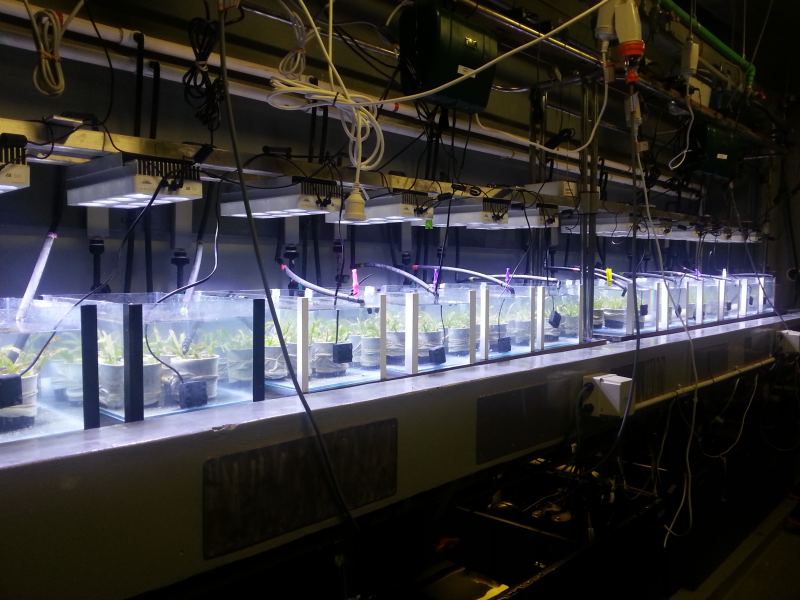
This dataset consists of one data file (spreadsheet) from a 2 week aquarium experiment manipulating pH (pCO2) changes and measuring photosynthetic and growth responses of three tropical seagrass species (Cymodocea serrulata, Halodule uninervis and Thalassia hemprichii). The aim of this study was to test the hypothesis that increased pCO2 would increase photosynthetic and growth rates to various extents between seagrass species. Method: This experiment exposed three seagrass species, Cymodocea serrulata, Halodule uninervis and Thalassia hemprichii, to four pCO2 treatments (440, 700, 890, 1204 µatm) for two weeks to investigate the effects of acidification on their physiology. These treatments were chosen to bracket the range of atmospheric CO2 levels predicted for different end-of-century emission scenarios in the near-future (2100). Each treatment was replicated across four aquaria, each with 2 duplicate pots per species. C. serrulata and H. uninervis were collected from the intertidal meadow at Cockle Bay, Magnetic Island, Great Barrier Reef (19°10.88’S, 146°50.63’E) in late March 2013. T. hemprichii was collected from Green Island in the Northern Great Barrier Reef (16°45.37’S, 145°58.19’E) in early April 2013. H. uninervis and sediment was collected as intact plugs. C. serrulata and T. hemprichii were collected by excavating intact shoots with connected horizontal rhizomes from the sediment. The experiment started two to four weeks after the collection. Photosynthetic rates and respiration of the second youngest leaf of a haphazardly chosen shoot from each pot were measured using optical oxygen sensors. Photosynthetic rates were measured over a series of light steps (10, 30, 70, 110, 220, 400, 510 µmol m-2 s-1), with each light step lasting 20 minutes. Rates were normalised to the dry weight of the leaf, after drying leaves at 60°C for 48 hours. To determine photosynthetic parameters (Pmax, alpha, Ek, Ec), photosynthesis versus irradiance (P-E) data plots were fitted to the adapted hyperbolic tangent model equation of Jassby and Platt (1976). Net productivity (NP) was taken to be the photosynthetic rate measured at the experimental light level (400 µmol m-2 s-1). Energetic surplus (PG:R) was calculated as the ratio of gross productivity to dark respiration rate. To measure growth rates, all shoots were marked at the top of the sheath with a needle at the start of the experiment. After 14 days, the shoots were harvested, the length of new tissue growth were excised, dried at 60°C for 48 hours and weighed for determination of weight of new leaf growth. Leaf tissue growth was normalised to the aboveground biomass to derive relative leaf growth rates (RGR). Specific leaf area (SLA) was calculated by dividing total leaf area with the total biomass of the leaves. Chlorophyll content was determined by acetone extraction of chlorophyll from a young mature leaf from each pot at the end of the experiment. To determine non-structural carbohydrates (NSC) content, roots and rhizomes were dried at 60°C for 48 hours, before being homogenised. Soluble carbohydrates were extracted with 80% ethanol at 80°C. The amount of soluble carbohydrates was assayed after removal of phenolic compounds and acid hydrolysis. Starch content was analysed from the residue of the soluble carbohydrate extraction through enzyme (amylase and amyloglucosidase) digestion. The concentration of glucose is measured using a commercially available glucose oxidase/peroxidase (GOPOD) testing reagent (Megazyme). Absorbance was then measured at 510 nm. Total non-structural carbohydrates (NSC) content was the sum of the amount of soluble carbohydrates and starch content. Format: Comma Separated File (CSV) Data Dictionary: seagrass_pCO2only.csv: - pH: Average of the calculated pH of the aquarium over the experimental period. - pCO2 (uatm): average pCO2 levels over two weeks. - Temp_real (oC): Average of measured temperatures of the aquarium over the experimental period (N=3). These were measured manually. - N_sampling: Number of water samples taken for pCO2 and pH determinations - Species: “CS”= Cymodocea serrulata, “HU”= Halodule uninervis, “TH”= Thalassia hemprichii - Aquaria: ID of the aquarium each pot was kept in. - Duplicate_pot: ID of duplicate pot of species in each aquaria - Resp (mgO2 g-1DW h-1): dark respiration rates of leaf from haphazardly choosen shoot from pot - Productivity (mgO2 g-1DW h-1): photosynthetic rates measured under experimental treatment light level (400 µmol m-2 s-1), measured after 14 days. - alpha: photosynthetic efficiency of shoot, calculated from the linear slope of fitted hyperbolic tangent curve (Jassby and Platt, 1976) P=P_max×tanh((alpha P_max)/E) - Ec (µmol m-2 s-1): Light level at which photosynthetic rate is equal to the dark respiration rate. - Ek (µmol m-2 s-1): Light level at which photosynthetic rate reaches maximal photosynthetic rate (Pmax). - Pmax (mgO2 g-1DW h-1): maximum photosynthetic rates, derived from fitted curve (shown above). - Pg:R_ratio: ratio of gross photosynthetic rate (Productivity+Resp) to dark respiration rates. - Chl_a (mg g-1FW): chlorophyll a content per gram fresh weight leaf tissue. - Chl_b (mg g-1FW): chlorophyll b content per gram fresh weight leaf tissue. - Growth (mg sht-1 d-1): increase in leaf biomass per pot, averaged over duration of experiment (14days) and normalise to number of shoots in pot. - RGR (g g-1 d-1): relative growth rate. Increase in leaf biomass per pot, averaged over duration of experiment (14days) and normalised to aboveground biomass in pot. - Specific leaf area: Total leaf area extended divided by the total biomass of the leaves. - SolCarbs (mg g-1DW): Soluble carbohydrates content per unit dry weight of rhizome tissue. Only 4 reps were analysed, i.e. 1 per aquaria. - Starch (mg g-1DW): Starch content per unit dry weight of rhizome tissue. Only 4 reps were analysed, i.e. 1 per aquaria. - NSC (mg g-1DW): Total non-structural carbohydrates content per unit dry weight of rhizome tissue. Only 4 reps were analysed, i.e. 1 per aquaria.